
Most men over fifty are managing their health the same way they managed their training before they understood programming: by feel, with occasional reference to a number that may or may not be telling the right story. They know what they weigh. They know roughly how they feel. They have a general sense of whether things are going well or not. And when they do get a blood test, they receive a result that sits in the normal range on a reference chart designed for the general population, hear that everything looks fine, and leave the appointment without any deeper understanding of where their biology stands.
The problem is not that the tests are inaccurate. The problem is that the standard panel covers a fraction of the biomarkers relevant to a man over fifty who is serious about his health, and that the reference ranges on most standard tests describe what is normal for a population that includes sedentary, metabolically compromised, and genuinely unwell individuals, not what is optimal for a man who is actively investing in his performance and longevity.
Normal and optimal are not the same number. A man can be normal on every marker in the standard panel and still be building toward cardiovascular disease, running a hormonal profile that is suppressing his muscle maintenance and cognitive function, or operating with a metabolic environment that is quietly accelerating his biological aging. He will not know any of this until he measures for it specifically.
This article describes what to measure, what the numbers mean, and how to use the data to manage health as a system rather than a series of individual symptoms responded to as they arise.
Why the Standard Panel Is Insufficient
The blood tests included in a routine annual physical visit were designed to screen for active disease in a general population. They were not designed to optimize the health of men who are already performing at a reasonably high level and who want to know not whether they are sick but where their trajectory is heading and how to improve it.
The standard lipid panel measures total cholesterol, LDL, HDL, and triglycerides. It does not measure apolipoprotein B, the particle count that more accurately predicts cardiovascular risk than LDL cholesterol concentration. It does not measure lipoprotein(a), an inherited cardiovascular risk factor present in approximately 20 percent of the population that the standard panel cannot detect. It does not measure high-sensitivity CRP, the inflammatory marker that is one of the most powerful independent predictors of cardiovascular events.
The standard thyroid test measures TSH alone, a signal from the brain to the thyroid rather than a measure of what the thyroid is producing. It does not measure free T3, the active thyroid hormone that most directly affects energy, metabolism, and cognitive function. Thyroid dysfunction often masquerades as normal aging, producing fatigue, brain fog, weight gain, and cold intolerance that are commonly attributed to getting older rather than to a treatable hormonal imbalance.
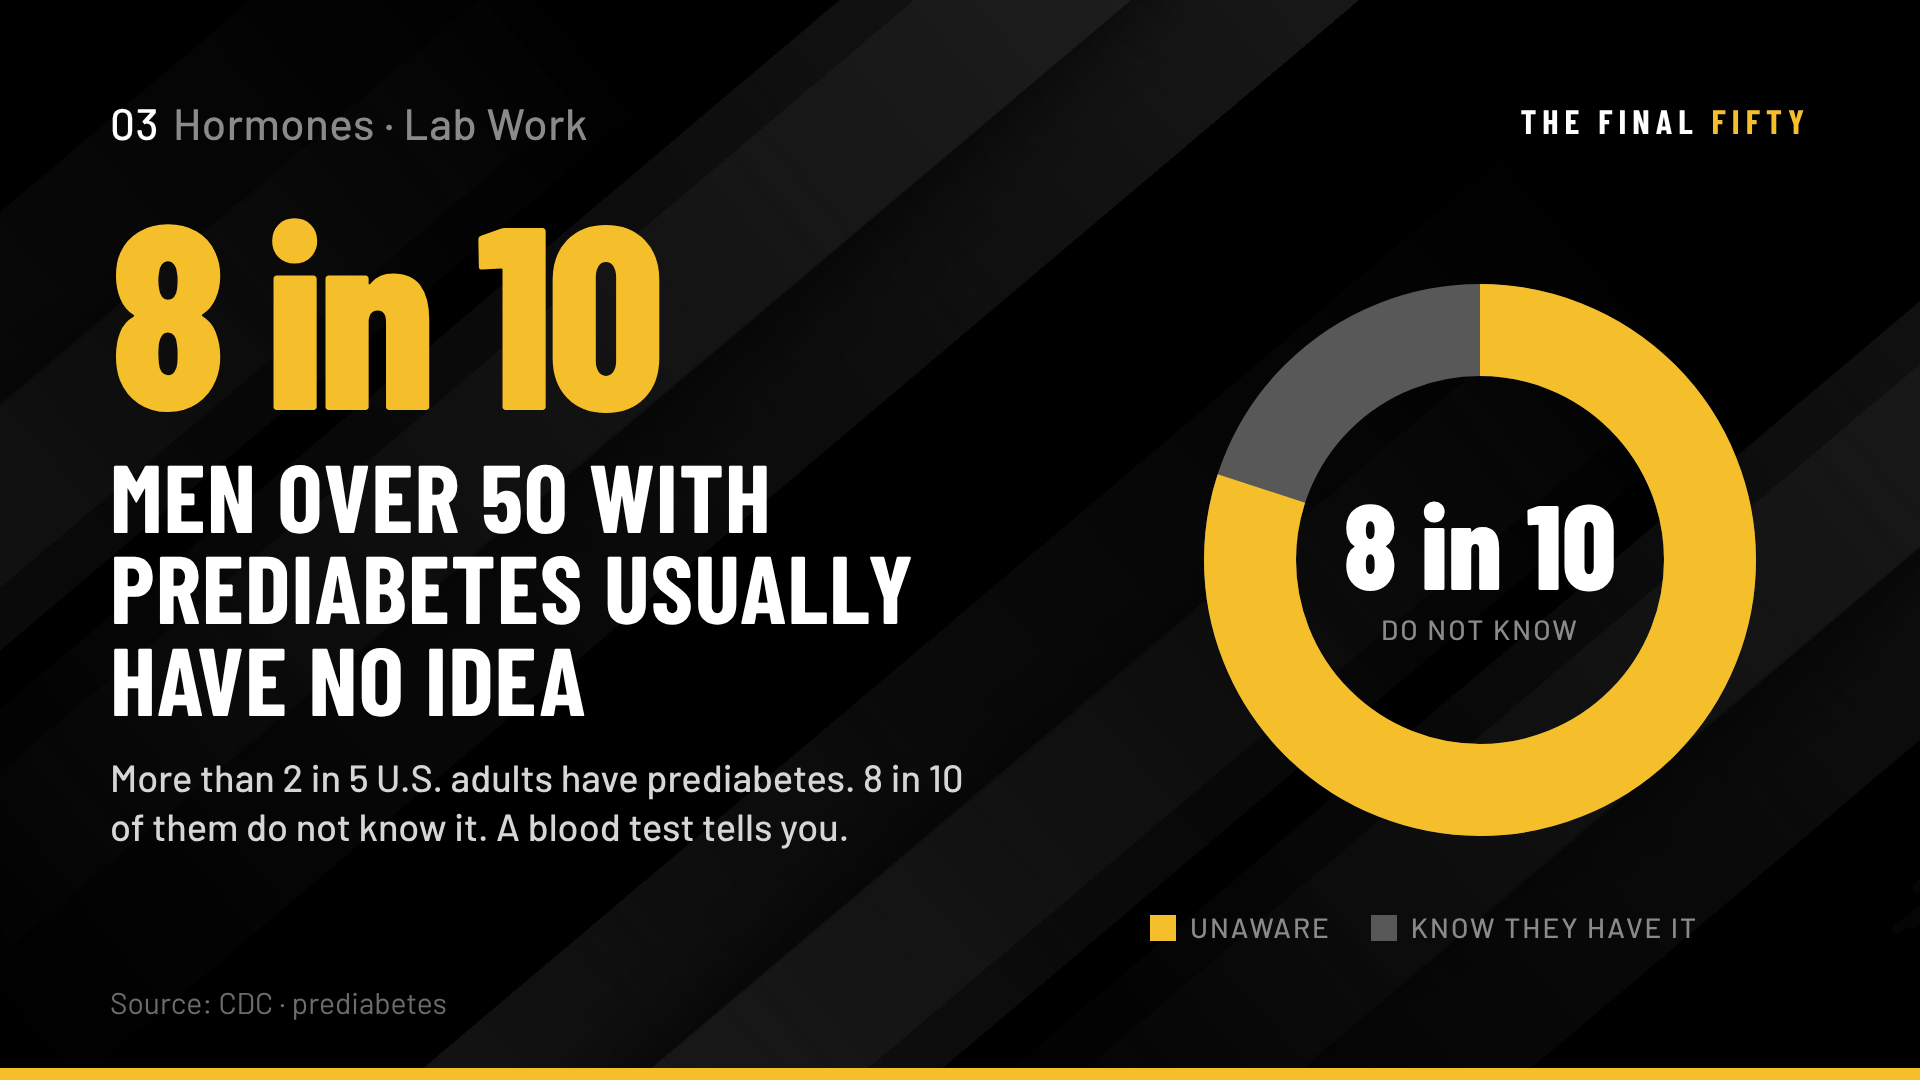
The standard glucose measurement captures a single fasting data point. It does not measure HbA1c, the three-month average blood glucose that identifies pre-diabetic trajectories that a single fasting measurement can miss. It does not measure fasting insulin, which reveals insulin resistance before glucose dysregulation is evident in glucose measurements. Over 80 percent of Americans with pre-diabetes are unaware of their condition precisely because the single glucose measurement that most panels include does not catch the problem early enough.
The standard testosterone test, when it is ordered at all, typically measures total testosterone alone. It does not measure free testosterone, the fraction that is biologically active and enters cells to produce the effects testosterone is responsible for. It does not measure SHBG, the protein that determines how much of the total testosterone is available versus bound and inactive. A man can have total testosterone in the normal range and free testosterone that is genuinely low, producing the full symptomatic picture of low testosterone, because his SHBG is elevated. Without measuring free testosterone and SHBG alongside total, the standard result tells only part of the hormonal story.
The Hormonal Panel That Actually Informs
The complete hormonal assessment for a man over fifty requires five measurements working together, not one number in isolation.
Total testosterone is the starting point and provides the overall picture of total hormone production. The American Urological Association diagnostic threshold for low testosterone is below 300 nanograms per deciliter on two morning tests, collected before 10 AM when testosterone is naturally at its daily peak. The broader reference range for adult men is approximately 300 to 1,000 nanograms per deciliter on most laboratory panels, though this range encompasses a significant portion of the male population that may be experiencing suboptimal hormonal function without meeting the formal diagnostic threshold for hypogonadism. A man with total testosterone of 350 nanograms per deciliter experiencing classic low testosterone symptoms, fatigue, reduced muscle maintenance, low libido, and cognitive slowing, may be a more appropriate candidate for optimization than a man with total testosterone of 250 nanograms per deciliter who is asymptomatic.
Free testosterone is often a better indicator than total testosterone of whether a man will experience the symptoms of low testosterone. Only about 2 to 3 percent of total testosterone circulates freely in the blood, unbound to any protein. This free testosterone is the fraction that can enter cells and produce the effects testosterone is responsible for. The remainder is bound to SHBG at approximately 60 to 70 percent and to albumin at approximately 30 to 40 percent. The albumin-bound fraction is loosely bound and remains partially bioavailable. The SHBG-bound fraction is effectively inactive. For adult men, free testosterone in the range of 35 to 155 picograms per milliliter represents the standard normal range, though functional adequacy relative to symptoms matters as much as the reference range in clinical context.
SHBG is the critical variable that links total testosterone to free testosterone. SHBG acts like a sponge for testosterone: the more SHBG in the blood, the more testosterone gets locked up and the less is free to do its work. Normal SHBG range is roughly 10 to 50 nanomoles per liter. Aging, liver conditions, hyperthyroidism, and certain medications raise SHBG. Obesity, insulin resistance, and hypothyroidism lower it. A man with total testosterone of 500 nanograms per deciliter and SHBG of 60 nanomoles per liter may have a lower free testosterone than a man with total testosterone of 400 nanograms per deciliter and SHBG of 20 nanomoles per liter. The SHBG number is essential for interpreting the total testosterone number accurately.
Estradiol is the primary estrogen in men and requires measurement alongside testosterone because the ratio between the two determines the net hormonal effect. As visceral fat increases with age, the aromatase enzyme in fat tissue converts testosterone to estradiol at an accelerating rate. Elevated estradiol in men is associated with fat accumulation, reduced libido, erectile dysfunction, and mood changes. The typical reference range for estradiol in men is approximately 10 to 40 picograms per milliliter, with functional optimization generally targeting the lower to middle portion of this range.
DHEA-S is the adrenal precursor hormone that declines significantly with age, with levels in men over fifty typically less than half those seen in men in their twenties and thirties. It serves as a precursor to both testosterone and estrogen and has documented relationships with energy, mood, immune function, and metabolic health. DHEA-S measurement provides context for the adrenal hormonal contribution to the overall hormonal picture that total and free testosterone measurements do not capture.
The Cardiovascular Risk Panel Beyond Basic Cholesterol
The cardiovascular risk picture that matters for men over fifty extends well beyond the four numbers on the standard lipid panel. Understanding what to measure and what the numbers mean is the difference between managing cardiovascular risk proactively and discovering it reactively when a clinical event makes it impossible to ignore.
Apolipoprotein B, ApoB, measures the number of LDL particles in the circulation rather than simply the cholesterol concentration within them. Two men with identical LDL cholesterol numbers can have dramatically different ApoB counts depending on LDL particle size, and ApoB is the more accurate predictor of cardiovascular risk because it is the particles themselves, not the cholesterol they carry, that embed in arterial walls and drive plaque formation. The 2023 American Heart Association and American College of Cardiology guidelines emphasize that ApoB should be measured in men with intermediate cardiovascular risk or where LDL-based risk assessment is uncertain.
Lipoprotein(a), Lp(a), is an inherited cardiovascular risk factor found in elevated levels in approximately 20 percent of the population. It is essentially a modified LDL particle with additional pro-thrombotic properties that dramatically elevates cardiovascular risk independent of standard cholesterol numbers. Unlike LDL cholesterol, Lp(a) cannot be meaningfully reduced through diet or standard statin therapy. It requires identification so that all other modifiable cardiovascular risk factors can be managed aggressively to offset the inherited risk. Every man should measure Lp(a) at least once. Many men with elevated Lp(a) discover it only after a cardiovascular event that a single additional test could have predicted years earlier.
High-sensitivity CRP is the primary blood marker of systemic inflammation and one of the most powerful independent predictors of cardiovascular disease available in blood testing. A reading below 1.0 milligrams per liter is optimal. Between 1.0 and 3.0 is elevated risk territory. Above 3.0 is a significant signal that demands intervention through the anti-inflammatory lifestyle approaches described throughout this content library. Half of all heart attack victims have normal cholesterol. High-sensitivity CRP is the test that catches what standard cholesterol misses.
Homocysteine is an amino acid that, when elevated, damages arterial walls and increases the risk of cardiovascular disease, stroke, and cognitive decline. Elevated homocysteine is a marker of methylation dysfunction, which is typically addressable through B vitamin supplementation, particularly B12, B6, and folate. Normal homocysteine is below 10 micromoles per liter, with optimal function generally below 8. Elevated homocysteine is common in men over fifty due to age-related changes in B vitamin absorption and metabolism.
The Metabolic and Nutrient Markers That Complete the Picture
Beyond hormones and cardiovascular markers, a complete assessment for men over fifty includes the metabolic and nutritional measurements that reveal the underlying conditions that everything else depends on.
HbA1c alongside fasting glucose provides the metabolic health picture that fasting glucose alone cannot. HbA1c below 5.7 percent is normal. Between 5.7 and 6.4 percent is pre-diabetic territory. Above 6.5 percent is diagnostic for type 2 diabetes. A man with fasting glucose of 95 milligrams per deciliter, considered normal, and HbA1c of 5.9 percent is in the pre-diabetic range and has actionable information that the glucose number alone did not provide.
Fasting insulin reveals insulin resistance before it becomes visible in glucose measurements. As insulin resistance develops, the pancreas produces more insulin to maintain normal glucose levels. Glucose looks normal. Insulin is elevated. The elevated insulin is the early signal. Optimal fasting insulin is below 5 micro-international units per milliliter. Between 5 and 10 is borderline. Above 10 with normal glucose indicates insulin resistance that dietary and exercise intervention can address before it progresses to pre-diabetes.
Vitamin D as 25-hydroxyvitamin D should be in the range of 40 to 60 nanograms per milliliter for optimal function. Below 30 is defined as deficient. Many physicians consider the lower end of the standard normal range, 20 nanograms per milliliter, acceptable when the research on testosterone production, immune function, bone density, and mood most consistently shows benefit at higher levels. Supplementation based on measured deficiency is more effective than supplementation based on assumption.
Vitamin B12 deficiency becomes more common after fifty because gastric acid production declines with age, and B12 requires gastric acid for absorption. The standard reference range begins at approximately 200 picograms per milliliter, but neurological symptoms can appear at levels below 400, and functional optimization generally targets the upper half of the normal range. Men who eat animal foods regularly are at lower risk for B12 deficiency, but measuring confirms adequacy rather than assuming it.
Complete blood count, CBC, reveals anemia, infection, and immune status through measurements of red blood cells, white blood cells, hemoglobin, and related markers. For men who train consistently, hemoglobin and hematocrit are particularly relevant as markers of oxygen-carrying capacity that directly affect training performance and recovery. Men on testosterone therapy require regular CBC monitoring because testosterone stimulates red blood cell production and elevated hematocrit is the most common dose-related adverse effect of TRT.
Comprehensive metabolic panel, CMP, covers kidney and liver function, electrolyte balance, and blood glucose in a single test. The liver function markers, AST, ALT, and GGT, reveal whether the liver is under metabolic stress from diet, alcohol, or other inputs. GGT in particular is emerging as a marker of metabolic and liver stress that often elevates before traditional liver enzymes do and is a useful early warning signal that many standard panels miss.
The Testing Schedule and How to Use the Data
Annual testing is the minimum standard for men over fifty who are managing their health proactively. For men who are optimizing hormone levels, monitoring the effects of dietary changes, or managing specific conditions, testing every three to six months provides the measurement frequency that allows meaningful trend analysis rather than just single data points.
The most important principle in using lab data effectively is trending rather than snapshot reading. A single measurement tells you where you are. Sequential measurements over time tell you which direction you are moving and how quickly. The man who measures his free testosterone, his ApoB, his high-sensitivity CRP, and his fasting insulin annually and tracks the trends across years is managing his biology as a system. The man who measures once and then not again until something prompts a visit is missing the information that would allow intervention before a trend becomes a clinical event.
Schedule blood draws in the morning, ideally between 7 and 10 AM, fasting for 8 to 12 hours for accuracy of glucose, lipid, and insulin measurements. Testosterone measurements are most reliable in the morning when levels are naturally at their daily peak. Testing outside this window produces lower numbers that may underestimate the true baseline.
Bring the results to your physician and ask specifically about the numbers that fall outside optimal range rather than accepting only the normal versus abnormal framing that reference ranges provide. The conversation that happens between a man who knows what he is looking for and a physician who is genuinely engaged in prevention is categorically different from the one that ends with everything looks fine. The data is available. The standard is the man who knows how to use it.
THE FINAL 50 FRAMEWORK
THE REFRAME
Lab work is not a passive screening ritual. It is the data collection system that allows a man to understand his biological trajectory rather than simply feeling his way through the decade without measurements. Normal on a reference chart designed for the general population is not the same as optimal for a man who is actively managing his performance and longevity. The panels described in this article, run annually at minimum, provide the specific data that makes health management an informed practice rather than a reactive one.
THE STANDARD
The Final 50 man runs a comprehensive panel annually that covers the three pillars: hormonal health through total testosterone, free testosterone, SHBG, estradiol, and DHEA-S; cardiovascular risk through ApoB, Lp(a) at least once, high-sensitivity CRP, and homocysteine alongside the standard lipid panel; and metabolic and nutritional status through HbA1c, fasting insulin, vitamin D, vitamin B12, complete blood count, and comprehensive metabolic panel. He reviews the results with specific attention to trends over time, not just whether each number falls within the reference range.
THE PRACTICE
Before your next blood draw, request the specific additions to the standard panel that your physician does not typically include. Write the list: free testosterone, SHBG, estradiol, DHEA-S, ApoB, high-sensitivity CRP, homocysteine, HbA1c, fasting insulin, vitamin D, and vitamin B12. Hand the list to your physician or the ordering provider. Most will accommodate specific requests when they are made clearly. The difference between the standard panel and the comprehensive panel is a conversation and a few additional test codes. The difference in the information returned is the difference between knowing and guessing.
THE AUDIT
Do you know your free testosterone number? Your ApoB? Your high-sensitivity CRP? Your fasting insulin? Your HbA1c? If the honest answer to any of these questions is no, you are managing the health variables most directly relevant to your performance, hormonal function, and longevity without the data those variables require to be managed intelligently. Identify which of these you have never measured. Schedule the panel. Get the numbers. Then manage from data rather than assumption.
THE PROMPT
The men in your brotherhood are each managing their health with whatever data they have, and most of them have never discussed what they are measuring and what they have found. Who in your circle runs a comprehensive panel annually and tracks his numbers over time? What has he learned from the data that changed his decisions about his training, nutrition, or lifestyle? That conversation, held specifically between men who take their health data seriously, produces the clearest picture of what this level of management looks like in practice.